On this page
I wanted to see what switching from Python to Go or Rust actually buys you when an API spends most of its time waiting on databases and other services. So I built the same small storefront API in all three and gave each one the same CPU, memory, and load.
The result I found most useful was how little the response times changed at equal load, while CPU and memory usage were quite different. Below are the measurements, the setup, and the code behind them.
The comparison is between Python with FastAPI and uvicorn, Go with net/http, and Rust with axum and tokio. Each service gets 2 CPUs and 512 MiB of memory, with a mock upstream latency of 30 ± 10 ms.
Benchmark snapshot: api-lang-bench, commit 0c751c1. Report generated September 13, 2026.
What the numbers say #
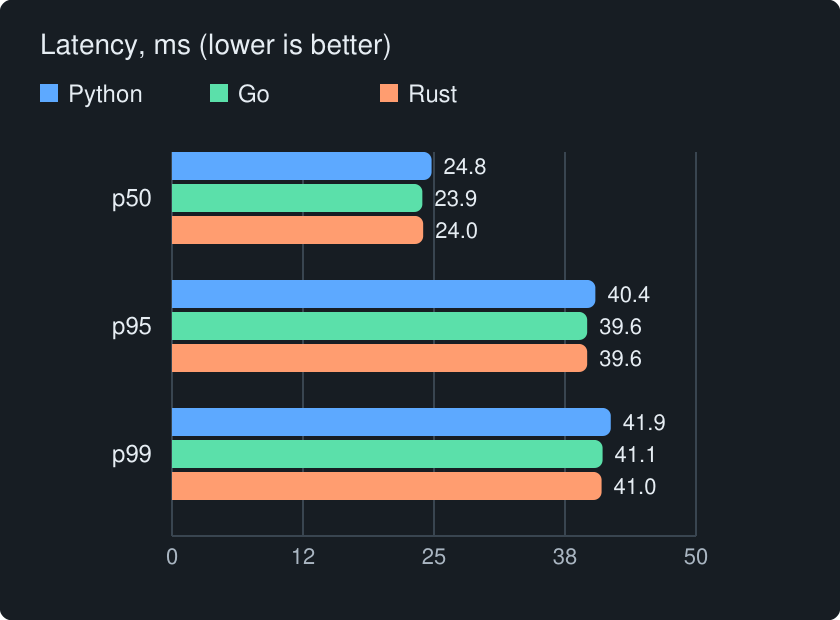
- At a fixed 500 requests per second mixed load, p50 latency differs by only 0.9 ms across the three: Python 24.8 ms, Go 23.9 ms, and Rust 24.0 ms. Waiting on the upstream service dominates this I/O-bound workload.
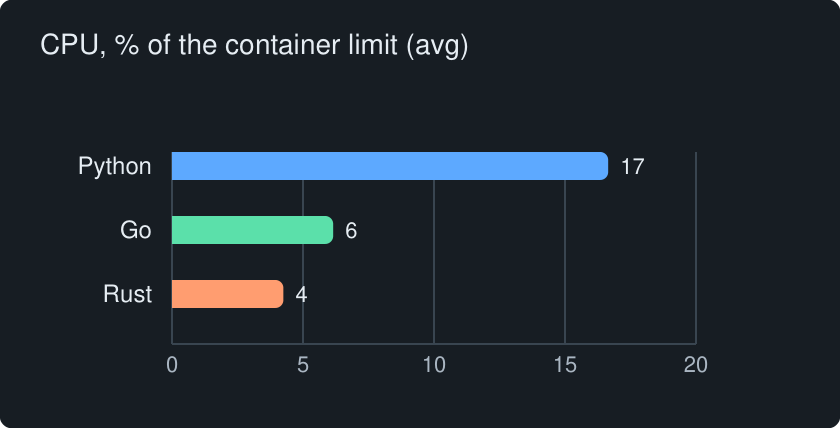
- CPU used at that load, as a percentage of the container limit: Rust 4%, Go 6%, Python 17%. Relative to Rust, the report measures Python at 3.9× and Go at 1.4×. The displayed percentages are rounded; the ratios use the underlying measurements.
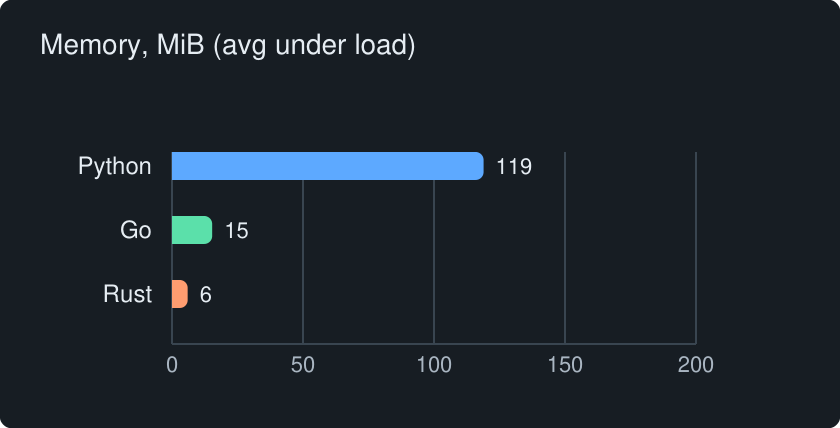
- Memory under load: Rust 6 MiB, Go 15 MiB, Python 119 MiB. Relative to Rust: Python 19.8×, Go 2.5×.
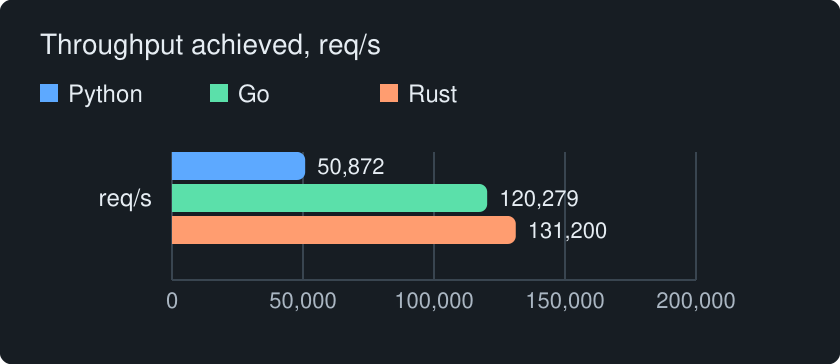
- Framework floor: throughput on
/healthwith a ramp to 50 virtual users reaches 50,872 requests/s for Python, 120,279 for Go, and 131,200 for Rust. Relative to Python, that is 2.4× for Go and 2.6× for Rust. - Under a stress profile ramping from 500 to 2,000 requests/s, all three averaged 1,249 achieved requests/s. Python recorded 0.01% failed requests and 9 dropped iterations; Go recorded 0.00% and 2; Rust recorded 0.00% and 3. Their p95 latencies were 40.5, 39.5, and 39.4 ms respectively.
- This stress run does not establish each implementation’s saturation point. To find that point, raise
RATEor lowerSVC_CPUSand repeat the profile. Python has the least headroom by measured CPU usage in this comparison.
The setup #
The same six endpoints exercise Postgres queries, Redis cache-aside access, upstream HTTP calls, JSON parsing, and response serialization. The mixed workload combines 40% browse, 25% search, 20% home, and 15% checkout. /health provides a separate framework-floor measurement without application I/O.
One service runs at a time. Postgres, Redis, the upstream mock, and k6 are outside the service’s CPU and memory limits.
The source report records a successful make parity check across 15 of 15 cases, with byte-identical JSON for identical inputs. That gives the timing comparison a useful starting point: the implementations returned the same results for the checked cases.
Machine and Docker environment #
| Component | Configuration |
|---|---|
| Host | Apple M4 Max, 16 cores, 64.0 GB RAM, arm64 |
| Operating system | macOS 26.6.2 |
| Docker Desktop VM | 10 vCPU, 9.7 GB RAM |
| Docker Engine / Compose | 29.7.2 / 5.5.1 |
| Load generator | grafana/k6:2.1.0 |
| Database / cache images | postgres:17-alpine, redis:7-alpine |
| Sampling | docker stats every approximately 1–2 seconds |
| Memory snapshots | Idle before warm-up; post-load 5 seconds after k6 stops |
These host details were probed when the report was generated; they were not stored with the individual runs. The service, database, cache, upstream mock, and load generator all share this VM, even though only the service has explicit resource limits.
Runtimes and libraries #
The artifact lists these runtime versions and dependencies from the lockfiles:
| Service | Runtime | Libraries |
|---|---|---|
| Python | Python 3.13 | FastAPI 0.141.1, uvicorn 0.52.4, uvloop 0.22.1, httptools 0.8.0, asyncpg 0.31.0, redis 8.1.0, httpx 0.28.1, orjson 3.12.0, pydantic 2.13.5 |
| Go | Go 1.27 | net/http and encoding/json from the standard library, pgx 5.11.0, go-redis 9.22.0, x/sync 0.23.0 |
| Rust | Rust 1.96 | axum 0.8.9, tokio 1.53.1, sqlx 0.9.0, redis 1.7.0, reqwest 0.13.5, serde_json 1.0.151 |
Shared settings #
| Setting | Value |
|---|---|
SVC_CPUS | 2 |
SVC_MEM | 512m |
PG_POOL_SIZE | 10 |
REDIS_POOL_SIZE | 10 |
HTTP_POOL_SIZE | 50 |
CACHE_TTL_S | 60 |
UPSTREAM_LATENCY_MS | 30 |
UPSTREAM_JITTER_MS | 10 |
UPSTREAM_HITS | 20 |
VUS | 50 |
WARMUP_S | 10 |
Python uses one uvicorn worker per CPU, with connection pools divided between workers. Go uses a single process with cgroup-aware GOMAXPROCS. Rust uses tokio worker threads matching the CPU allowance and a multiplexed Redis connection, so REDIS_POOL_SIZE does not apply to Rust in the same way.
Reading CPU correctly: the charts and article tables show average CPU as a percentage of the two-CPU container limit, where 100% means the whole allowance. The downloadable results also retain the original docker stats host-core percentages, where 200% means two full cores. Normalization uses the unrounded measurements before display rounding.
All memory figures in the article tables are average container memory under load, in MiB. Python’s figure includes its worker processes.
The same endpoint, three ways #
Numbers only tell part of the story. Here are the actual handlers from the report, so you can compare what each implementation does. Shared helpers and imports are omitted; these are excerpts from the benchmark services, not standalone programs.
Open an endpoint to see its Python, Go, and Rust versions.
GET /products/{id}Product lookup with Redis cache-aside
The handler returns cached JSON when available. On a cache miss it reads Postgres, serializes the product, and stores it with a TTL.
@router.get("/products/{product_id}")
async def get_product(product_id: str, request: Request) -> Response:
    try:
        pid = int(product_id)
    except ValueError:
        pid = 0
    if pid < 1:
        raise HTTPException(400, "bad id")
    st = request.app.state
    key = f"product:{pid}"
    cached = await st.cache.get(key)
    if cached is not None:
        return Response(cached, media_type="application/json")
    product = await st.store.get(pid)
    if product is None:
        raise HTTPException(404, "product not found")
    body = orjson.dumps(product)
    await st.cache.set(key, body)
    return Response(body, media_type="application/json")
func (d Deps) getProduct(w http.ResponseWriter, r *http.Request) {
	id, err := strconv.Atoi(r.PathValue("id"))
	if err != nil || id < 1 {
		writeErr(w, http.StatusBadRequest, "bad id")
		return
	}
	ctx := r.Context()
	key := "product:" + strconv.Itoa(id)
	if b, err := d.Cache.Get(ctx, key); err == nil {
		writeRaw(w, b)
		return
	}
	p, err := d.Store.Get(ctx, id)
	if errors.Is(err, store.ErrNotFound) {
		writeErr(w, http.StatusNotFound, "product not found")
		return
	}
	if err != nil {
		writeErr(w, http.StatusInternalServerError, "db: "+err.Error())
		return
	}
	b, _ := json.Marshal(p)
	if err := d.Cache.Set(ctx, key, b); err != nil {
		log.Printf("cache set: %v", err)
	}
	writeRaw(w, b)
}
async fn get_product(State(s): State<AppState>, Path(id): Path<String>) -> ApiResult<Response> {
    let id: i32 = match id.parse() {
        Ok(n) if n >= 1 => n,
        _ => return Err(ApiError::BadRequest("bad id".into())),
    };
    let key = format!("product:{id}");
    if let Some(b) = s.cache.get(&key).await? {
        return Ok(raw_json(b));
    }
    let p = s.store.get(id).await?.ok_or_else(|| ApiError::NotFound("product not found".into()))?;
    let b = serde_json::to_vec(&p).expect("product serialises");
    if let Err(e) = s.cache.set(&key, &b).await {
        eprintln!("cache set: {e}");
    }
    Ok(raw_json(b))
}
POST /cart/checkoutValidate a cart and calculate the total
Each version parses and validates the request, fetches product prices in one Postgres query, calls the upstream tax service, and returns the total.
@router.post("/cart/checkout")
async def cart_checkout(body: CheckoutRequest, request: Request) -> ORJSONResponse:
    st = request.app.state
    items = [checkout.Item(i.sku, i.qty) for i in body.items]
    try:
        checkout.validate(items)
        prices = await st.store.prices_by_sku([i.sku for i in items])
        receipt = checkout.subtotal(items, prices)
    except checkout.InvalidCart as e:
        raise HTTPException(400, str(e)) from e
    tax = await st.upstream.tax(receipt.subtotal_cents, "UK")
    return ORJSONResponse(checkout.with_tax(receipt, tax))
func (d Deps) checkout(w http.ResponseWriter, r *http.Request) {
	var body struct {
		Items []checkout.Item `json:"items"`
	}
	if err := json.NewDecoder(r.Body).Decode(&body); err != nil {
		writeErr(w, http.StatusBadRequest, "bad json: "+err.Error())
		return
	}
	if err := checkout.Validate(body.Items); err != nil {
		writeErr(w, http.StatusBadRequest, err.Error())
		return
	}
	ctx := r.Context()
	skus := make([]string, len(body.Items))
	for i, it := range body.Items {
		skus[i] = it.SKU
	}
	prices, err := d.Store.PricesBySKU(ctx, skus)
	if err != nil {
		writeErr(w, http.StatusInternalServerError, "db: "+err.Error())
		return
	}
	receipt, err := checkout.Subtotal(body.Items, prices)
	if err != nil {
		writeErr(w, http.StatusBadRequest, err.Error())
		return
	}
	tax, err := d.Upstream.Tax(ctx, receipt.SubtotalCents, "UK")
	if err != nil {
		writeErr(w, http.StatusBadGateway, "upstream: "+err.Error())
		return
	}
	writeJSON(w, http.StatusOK, checkout.WithTax(receipt, tax))
}
async fn cart_checkout(
    State(s): State<AppState>,
    body: Result<Json<CheckoutRequest>, JsonRejection>,
) -> ApiResult<Json<Receipt>> {
    let Json(body) = body.map_err(|e| ApiError::BadRequest(format!("bad json: {}", e.body_text())))?;
    checkout::validate(&body.items).map_err(|e| ApiError::BadRequest(e.0))?;
    let skus: Vec<String> = body.items.iter().map(|i| i.sku.clone()).collect();
    let prices = s.store.prices_by_sku(&skus).await?;
    let receipt = checkout::subtotal(&body.items, &prices).map_err(|e| ApiError::BadRequest(e.0))?;
    let tax = s.upstream.tax(receipt.subtotal_cents, "UK").await?;
    Ok(Json(checkout::with_tax(receipt, tax)))
}
GET /homeFetch three dependencies concurrently
The home endpoint starts the upstream search, Postgres query, and Redis lookup concurrently, then combines their results into one response.
@router.get("/home")
async def home(request: Request) -> ORJSONResponse:
    """Fan-out to upstream + Postgres + Redis concurrently, then merge."""
    st = request.app.state
    featured, top, banner = await asyncio.gather(
        st.upstream.search("featured"), st.store.top(10), st.cache.get("banner"),
    )
    return ORJSONResponse({"featured": _to_results(featured["hits"]), "top_products": top, "banner": (banner or b"").decode()})
// home fans out to all three dependencies concurrently and merges.
func (d Deps) home(w http.ResponseWriter, r *http.Request) {
	g, ctx := errgroup.WithContext(r.Context())
	var (
		featured upstream.SearchResponse
		top      []store.Product
		banner   []byte
	)
	g.Go(func() (err error) { featured, err = d.Upstream.Search(ctx, "featured"); return })
	g.Go(func() (err error) { top, err = d.Store.Top(ctx, 10); return })
	g.Go(func() (err error) {
		banner, err = d.Cache.Get(ctx, "banner")
		if errors.Is(err, cache.ErrMiss) {
			banner, err = []byte(""), nil
		}
		return
	})
	if err := g.Wait(); err != nil {
		writeErr(w, http.StatusBadGateway, err.Error())
		return
	}
	writeJSON(w, http.StatusOK, homeResponse{Featured: toResults(featured.Hits), TopProducts: top, Banner: string(banner)})
}
/// Fan-out to upstream + Postgres + Redis concurrently, then merge.
async fn home(State(s): State<AppState>) -> ApiResult<Json<HomeOut>> {
    let (featured, top, banner) = tokio::try_join!(
        async { s.upstream.search("featured").await.map_err(ApiError::from) },
        async { s.store.top(10).await.map_err(ApiError::from) },
        async { s.cache.get("banner").await.map_err(ApiError::from) },
    )?;
    let banner = String::from_utf8_lossy(&banner.unwrap_or_default()).into_owned();
    Ok(Json(HomeOut { featured: to_results(featured.hits), top_products: top, banner }))
}
Every run, by scenario and load shape #
The constant profile holds a fixed arrival rate. The ramp profile increases virtual users. The stress profile increases the arrival rate from RATE to four times that value. Latency values below are milliseconds; CPU values are rounded percentages of the container limit.
Mixed workload: 500 requests/s #
SCENARIO=mixed, PROFILE=constant, RATE=500, DURATION=60s.
| Service | Requests/s | p50 | p95 | p99 | CPU % of limit | Memory MiB |
|---|---|---|---|---|---|---|
| Python | 500 | 24.8 | 40.4 | 41.9 | 17 | 119 |
| Go | 500 | 23.9 | 39.6 | 41.1 | 6 | 15 |
| Rust | 500 | 24.0 | 39.6 | 41.0 | 4 | 6 |
All three recorded 0.00% failed requests and zero dropped iterations.
Framework floor: health endpoint #
SCENARIO=health, PROFILE=ramp, VUS=50, DURATION=30s. The shared configuration retains RATE=500, but this profile is driven by virtual users rather than a fixed request rate.
| Service | Requests/s | p50 | p95 | p99 | CPU % of limit | Memory MiB |
|---|---|---|---|---|---|---|
| Python | 50,872 | 0.8 | 1.0 | 1.2 | 96 | 116 |
| Go | 120,279 | 0.1 | 0.8 | 1.3 | 70 | 14 |
| Rust | 131,200 | 0.1 | 0.8 | 1.4 | 56 | 4 |
All three recorded 0.00% failed requests and zero dropped iterations.
Mixed workload: 1,500 requests/s #
SCENARIO=mixed, PROFILE=constant, RATE=1500, DURATION=60s.
| Service | Requests/s | p50 | p95 | p99 | CPU % of limit | Memory MiB |
|---|---|---|---|---|---|---|
| Python | 1,499 | 24.8 | 40.6 | 42.1 | 43 | 121 |
| Go | 1,499 | 23.7 | 39.5 | 40.9 | 10 | 18 |
| Rust | 1,499 | 23.8 | 39.4 | 40.9 | 8 | 7 |
All three recorded 0.00% failed requests. Python had 4 dropped iterations; Go and Rust had zero.
Mixed workload: stress #
SCENARIO=mixed, PROFILE=stress, RATE=500, DURATION=60s. The arrival-rate target ramps from 500 to 2,000 requests/s.
| Service | Requests/s | p50 | p95 | p99 | CPU % of limit | Memory MiB |
|---|---|---|---|---|---|---|
| Python | 1,249 | 24.7 | 40.5 | 42.1 | 33 | 120 |
| Go | 1,249 | 23.7 | 39.5 | 40.9 | 9 | 18 |
| Rust | 1,249 | 23.6 | 39.4 | 40.9 | 7 | 7 |
| Service | Failed requests % | Dropped iterations |
|---|---|---|
| Python | 0.01 | 9 |
| Go | 0.00 | 2 |
| Rust | 0.00 | 3 |
The 1,249 requests/s figure is the achieved average over the ramp, not its peak target. Failed requests and dropped iterations are separate measurements; both matter when interpreting the result.
Search: 500 requests/s #
SCENARIO=search, PROFILE=constant, RATE=500, DURATION=60s. This scenario waits on upstream HTTP, then parses and reshapes the response.
| Service | Requests/s | p50 | p95 | p99 | CPU % of limit | Memory MiB |
|---|---|---|---|---|---|---|
| Python | 500 | 31.3 | 40.8 | 41.7 | 17 | 121 |
| Go | 500 | 30.8 | 40.3 | 41.2 | 5 | 15 |
| Rust | 500 | 30.7 | 40.2 | 41.1 | 3 | 6 |
All three recorded 0.00% failed requests and zero dropped iterations.
How to read these results #
These are relative measurements on one machine. The services ran inside Docker Desktop on macOS, which uses a Linux VM. Compare the implementations within this setup; the figures are not production capacity estimates.
At equal load, the I/O-bound endpoints have very similar latency. CPU and memory are where the implementations separate. The /health results show a different part of the picture: what happens when application I/O is removed.
There is another limit worth keeping in mind: k6 generates the load from inside the same VM. It can also bound the maximum throughput measured by the /health ramp, so those numbers are not an isolated measure of server capacity.
The tests cover these particular frameworks, libraries, worker configurations, and workloads. To establish capacity for another environment, repeat the measurements on that environment and continue the load ramp until the limits are visible.
Download the complete results for all 15 runs (CSV), including error rates, dropped iterations, raw average and maximum CPU, and idle, average, maximum, and post-load memory.